Self-Storage REIT Highlights
CubeSmart
- Pricing and Rate Stabilization: CubeSmart reported new customer rates down 10.3% year-over-year in Q4, improving to a 7.4% decline by February 2025, with further improvement expected heading into the peak leasing season.
- Occupancy Trends: Same-store occupancy ended 2024 down 100 basis points year-over-year, recovering from a wider gap earlier in the year as pricing flexibility and targeted promotions helped offset demand softness.
- Strategic Acquisitions: CubeSmart acquired its partner’s 80% stake in a 14-property Dallas portfolio, representing $452.8 million of investment, strengthening its presence in a high-growth metro despite near-term rate pressure.
Extra Space Storage
- Leasing and Rate Trends: Extra Space saw new customer rates decline 6% year-over-year by the end of Q4, improving from a 9% decline in Q3, supported by strong marketing conversion and targeted rate adjustments in higher-barrier markets.
- Occupancy Leadership: Same-store occupancy finished the year at 93.7%, up 70 basis points year-over-year, giving Extra Space the highest occupancy rate among its peers following its successful integration of Life Storage.
- Capital Deployment: Extra Space deployed $950 million into acquisitions, joint ventures, and bridge loans in 2024, including $610 million in Q4 alone, while expanding its third-party management platform by over 600 stores for the year.
National Storage Affiliates
- Revenue and Occupancy Recovery: NSA reported same-store rental revenue down 4.47% year-over-year, reflecting heavy pricing competition in secondary markets, but occupancy stabilized to down 160 basis points, recovering from an initial 270 basis point gap at the start of the year.
- Portfolio Optimization: NSA sold 49 non-core properties for $270 million, redeploying capital into $65 million of new acquisitions and $150 million in joint venture investments, targeting higher-growth submarkets with improving supply-demand balance.
- Operational Consolidation: 2024 marked the completion of NSA’s internalization of its PRO structure, consolidating operations under a unified platform and creating operational efficiencies that position the REIT for enhanced profitability as market conditions improve.
Public Storage
- Operational Performance: Public Storage ended 2024 with same-store revenue declining by 0.6% year-over-year, though sequential improvement in Q4 marked the first quarterly revenue acceleration in more than two years, demonstrating stabilizing fundamentals in core markets.
- Occupancy and Cost Control: Same-store occupancy held at 90.5%, while on-site labor hours were reduced by 30% through expanded use of AI-powered staffing models and remote management technologies.
- External Growth: Public Storage completed $221 million in acquisitions during Q4, primarily targeting urban infill locations where supply pipelines are shrinking, positioning the company for future rent recovery and value growth.
Thoughts from the CEO’s
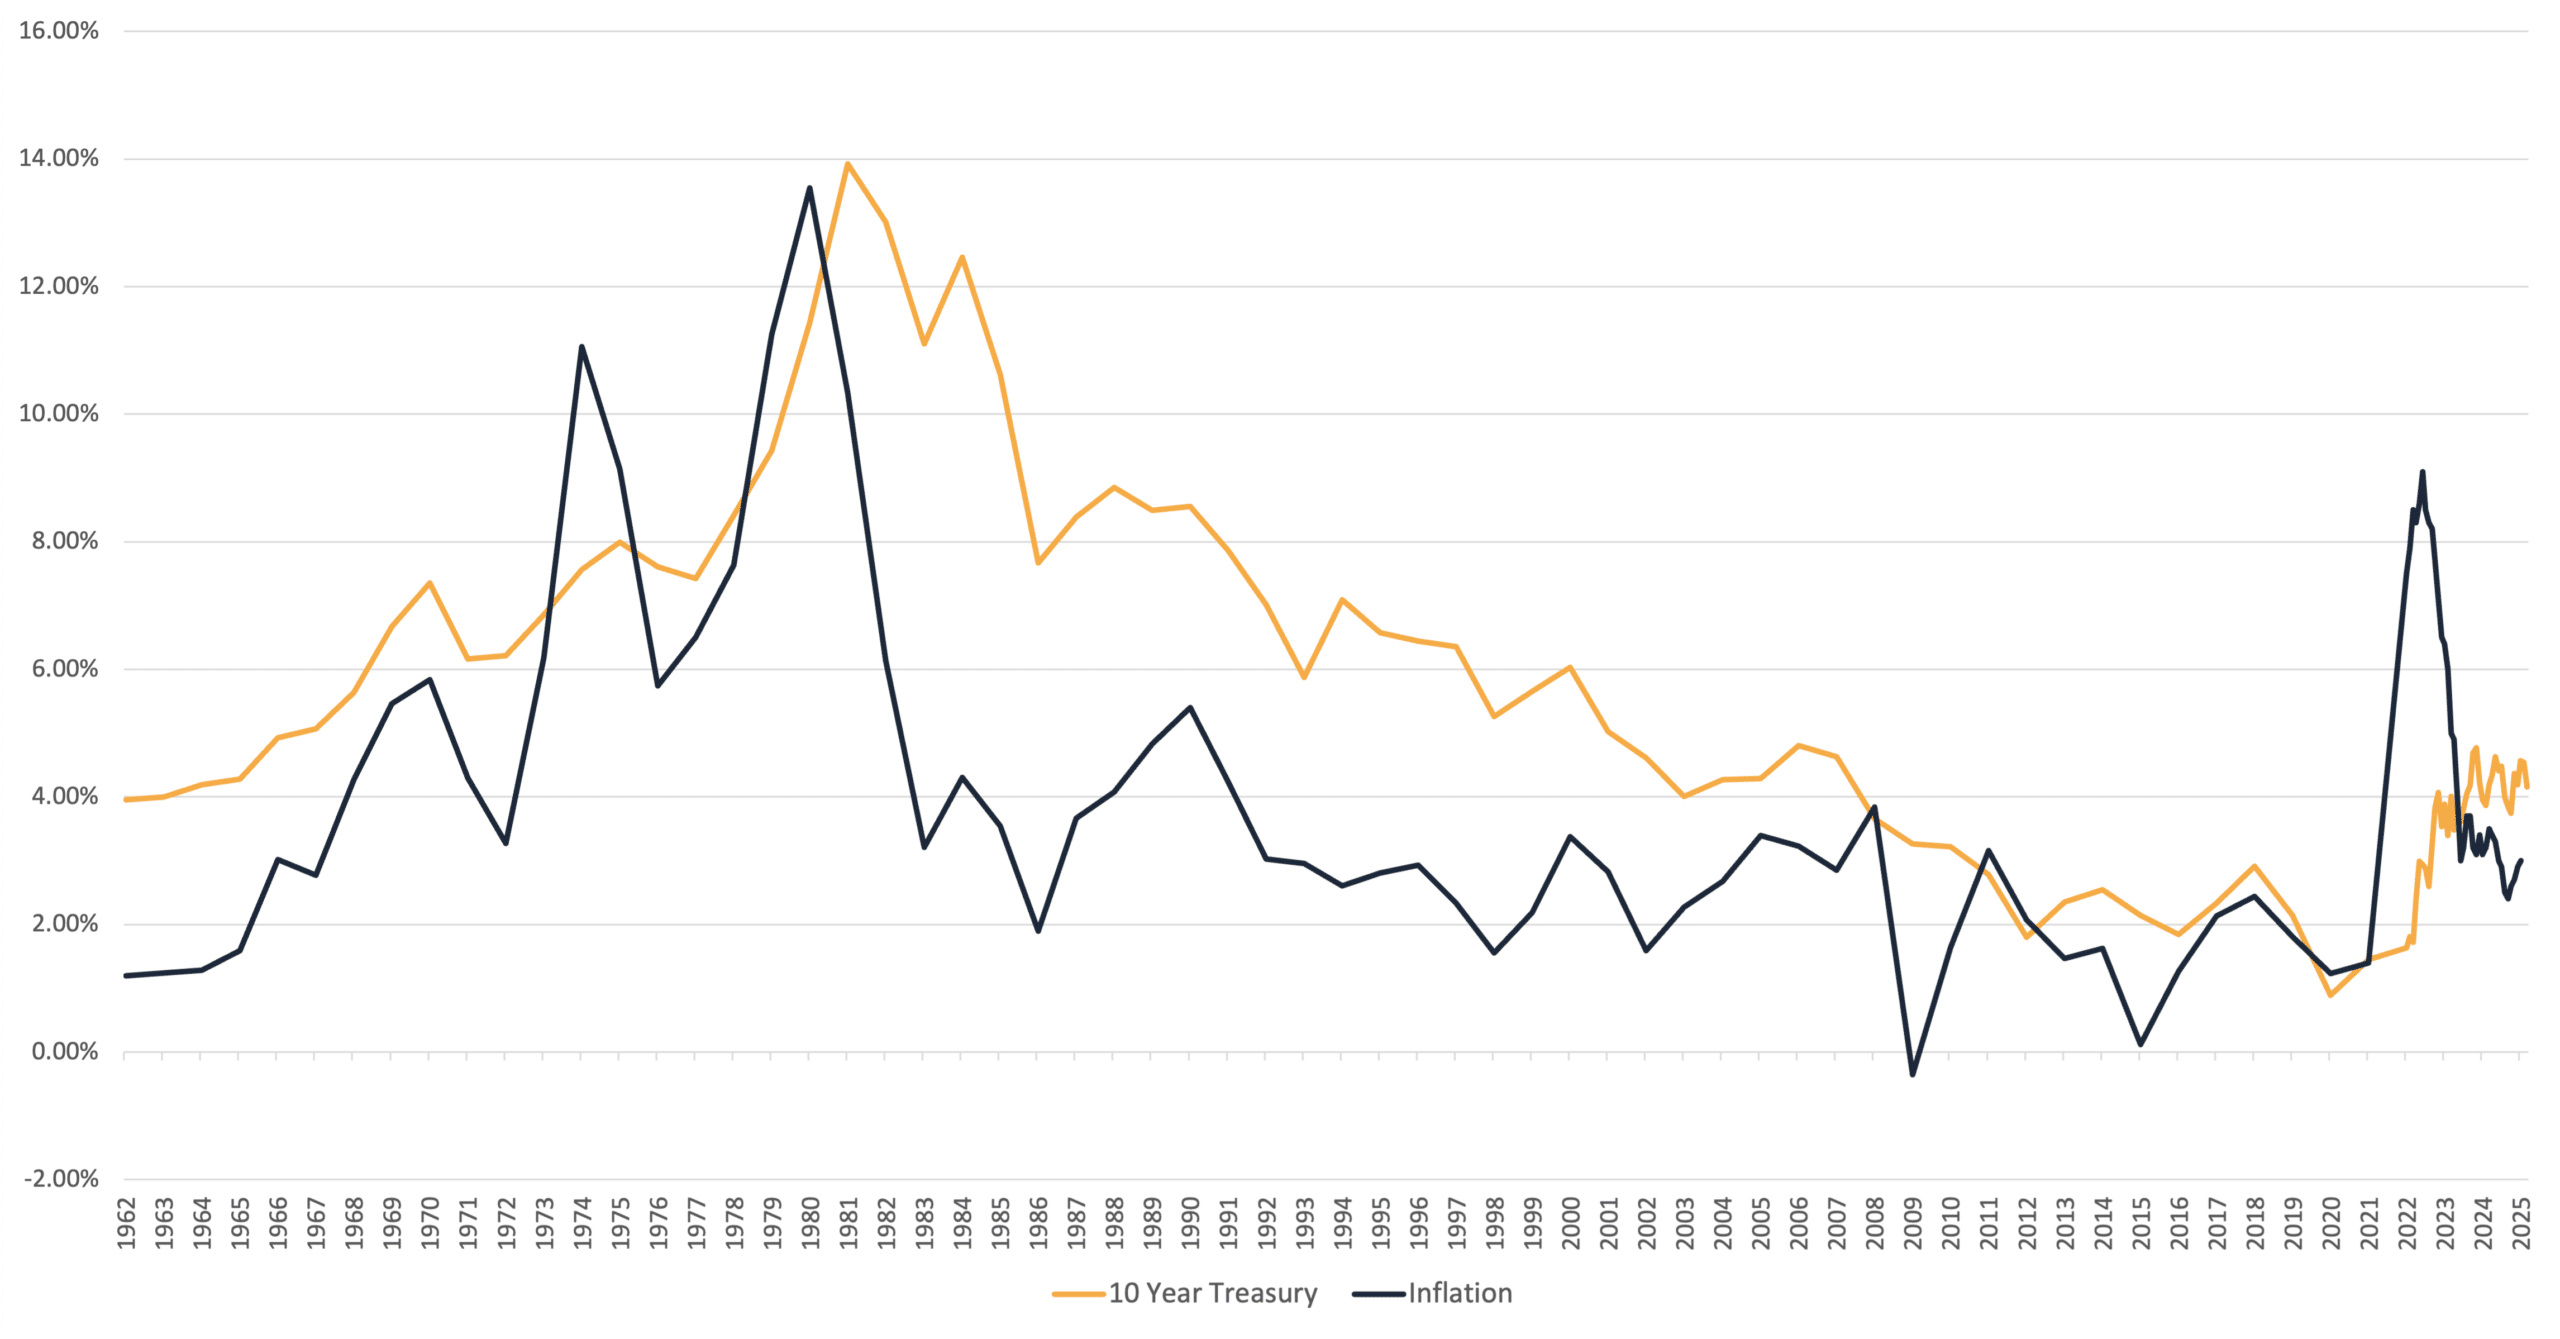
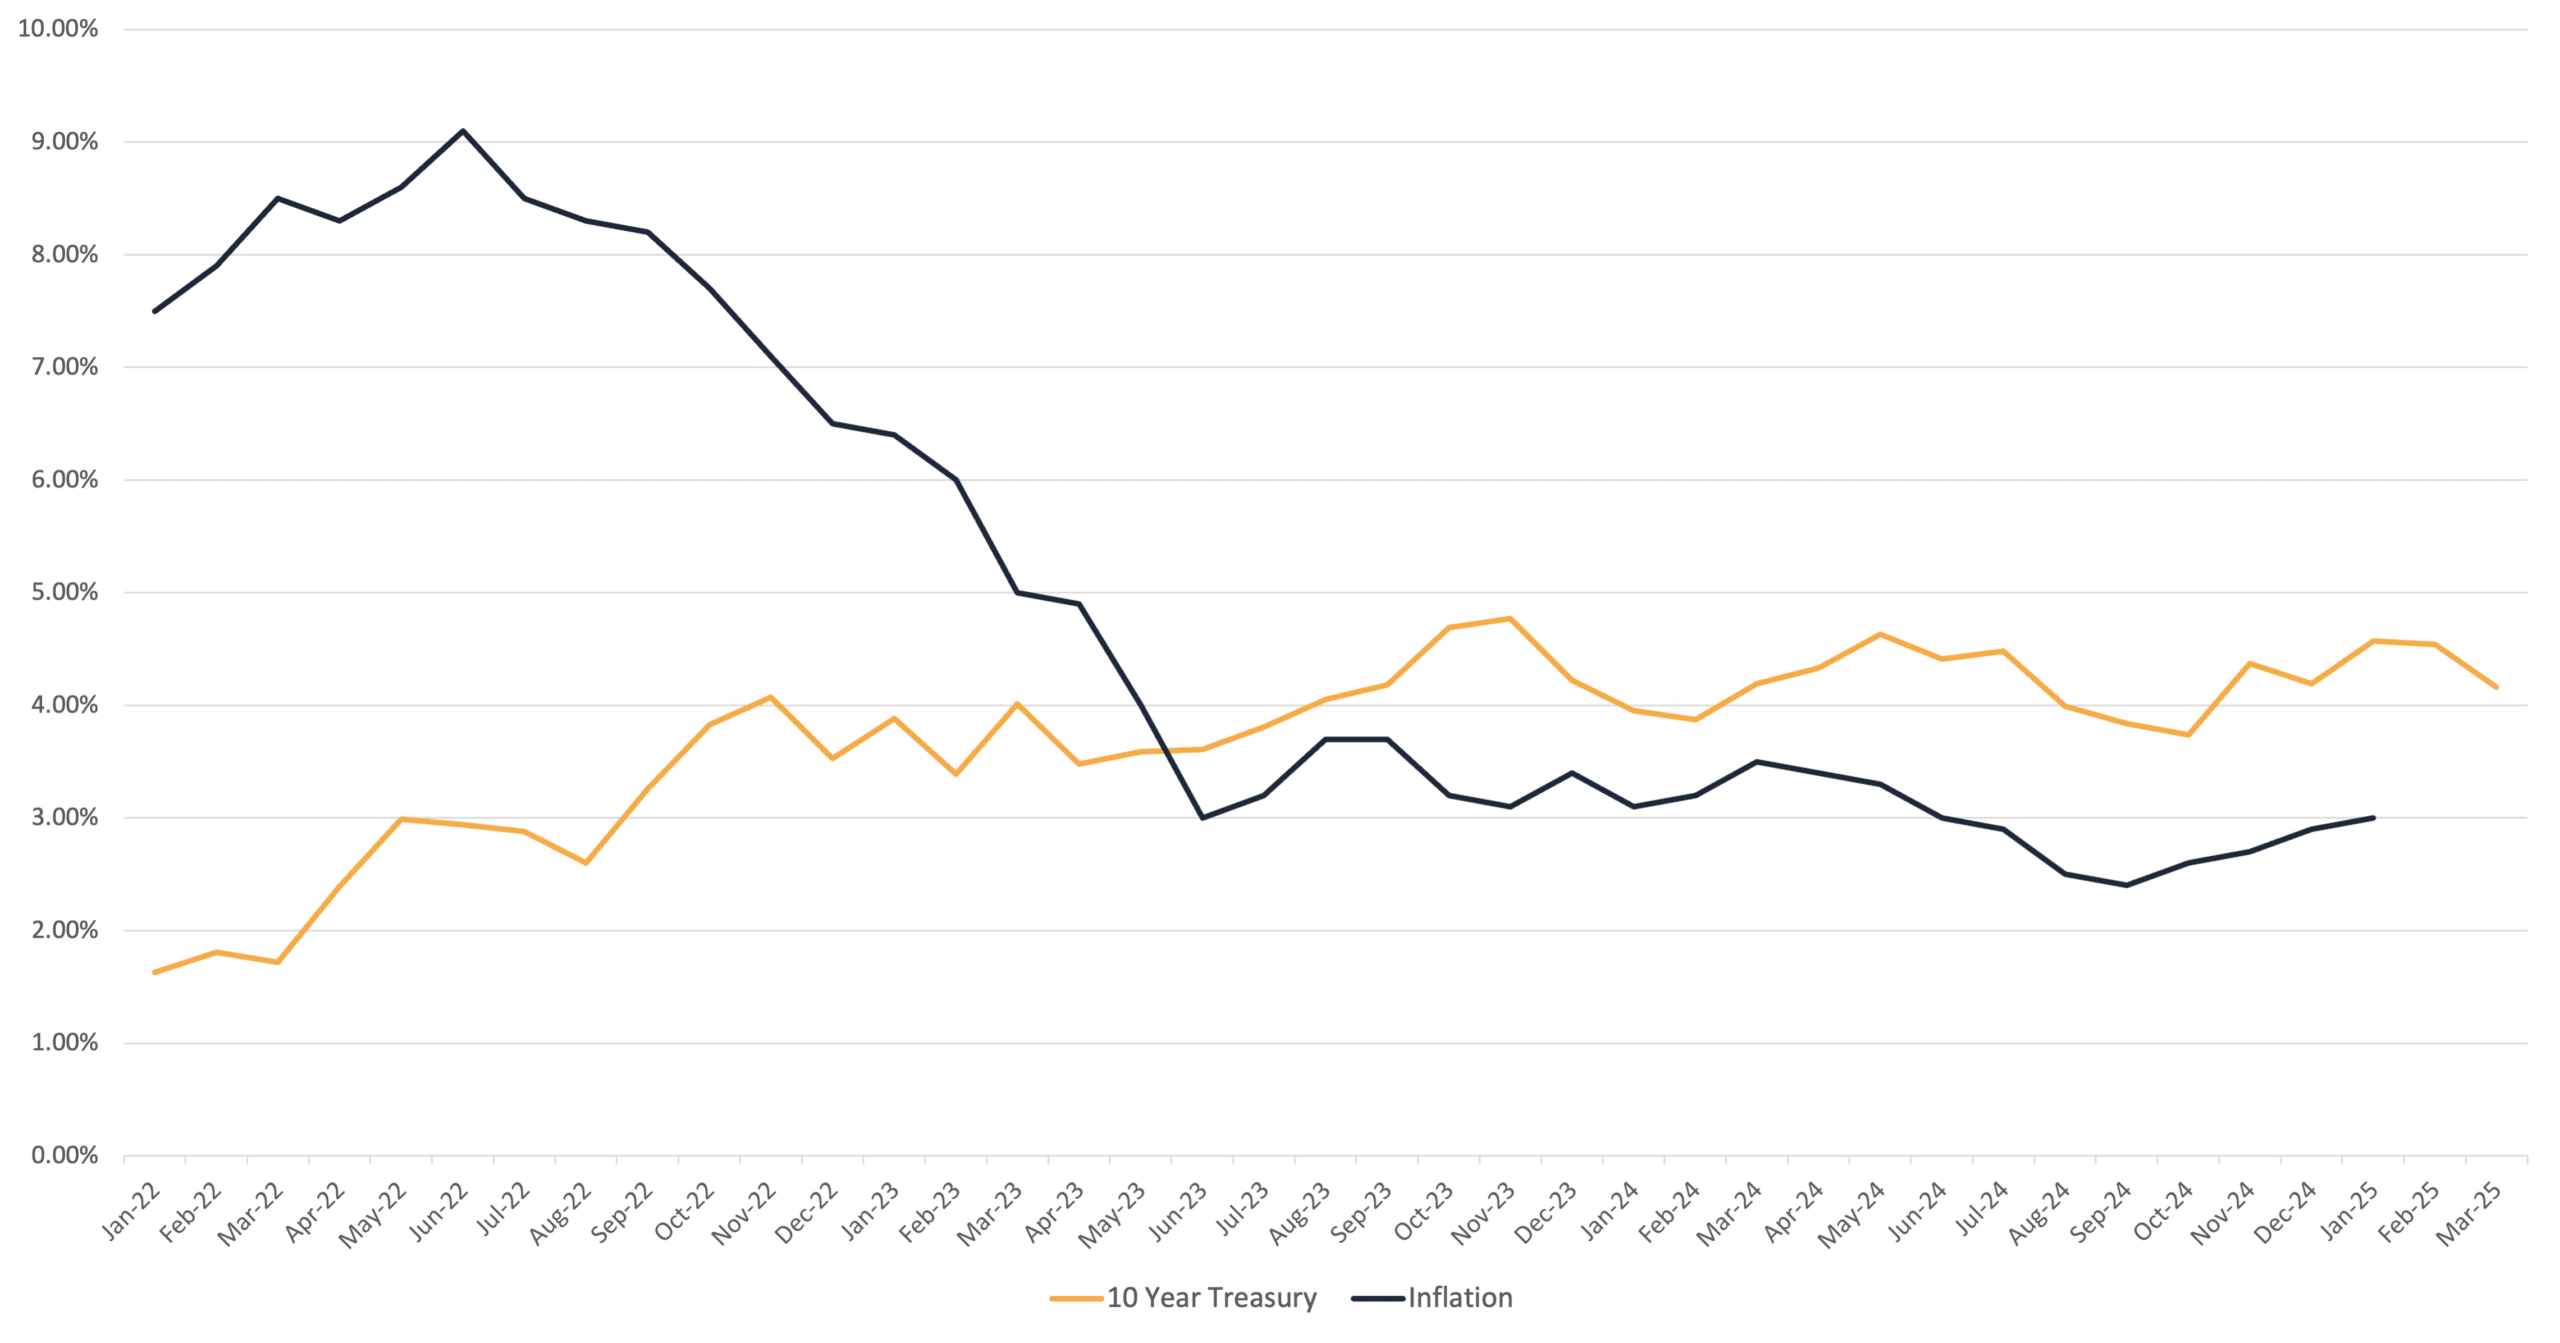
Macroeconomic Highlights
Q4 2024 Self-Storage REIT Data Overview
| Same Store Ending Occupancy | Same Store YoY Revenue Increase | Same Store YoY Expense Increase | Same Store YoY NOI Increase | Same Store Achieved Rate | Q4 Acquisitions | ||||||||
| 2024 | 2023 | 2024 | 2023 | 2024 | 2023 | 2024 | 2023 | 2024 | 2023 | % Change | 2024 | 2023 | |
| CUBE | 89.30% | 90.30% | -2.20% | 0.50% | 4.70% | -1.80% | -3.70% | 1.20% | $23.86 | $24.00 | -0.6% | 16 | 1 |
| EXR | 93.70% | 93.00% | -0.20% | 0.70% | 9.50% | 4.00% | -3.50% | -0.10% | $21.63 | $22.88 | -5.5% | 38 | 7 |
| NSA | 84.40% | 86.00% | -4.47% | -0.50% | 4.70% | 4.80% | -7.50% | -1.60% | $15.56 | $16.05 | -3.1% | 4 | 2 |
| PSA | 90.50% | 91.60% | -0.60% | 0.60% | 1.30% | 8.20% | -1.00% | -1.00% | $22.89 | $23.04 | -0.7% | 17 | 11 |
Q4 2024 Self-Storage Operating Fundamentals
Self-Storage Rental Rates
Same-store revenue growth was negative across all major self-storage REITs in 2024, reflecting the combined drag from lower move-in rates, reduced ECRI pacing, and modest occupancy softening. Public Storage reported that same-store rental revenue fell by 0.6% in Q4. Extra Space Storage experienced a decline of 0.4% in same-store revenue for the same period. CubeSmart saw a drop of 1.6% in same-store revenue in Q4. National Storage Affiliates (NSA) reported the sharpest decline at 4.3%, attributable to its heavier exposure to supply-challenged secondary markets.
Expenses grew substantially faster than revenue, leading to widespread NOI compression. CubeSmart’s property taxes surged by 17.5% year-over-year in Q4. Extra Space Storage saw same-store expenses rise by 9.5%, driven by property tax increases in Georgia and Illinois. NSA’s expenses increased by 4.7%, primarily due to higher marketing, utilities, and insurance premiums.

Self-Storage Occupancy

Self-Storage Income & Expenses
Same-store revenue growth was negative across all major self-storage REITs in 2024. Public Storage’s same-store rental revenue fell by 0.6%. Extra Space Storage experienced a decline of 0.4%. CubeSmart reported a drop of 1.6%. National Storage Affiliates (NSA) saw the sharpest decline at 4.3%, due to its heavier exposure to supply-challenged secondary markets. These declines reflect the combined drag from lower move-in rates, reduced ECRI pacing, and modest occupancy softening.
Expenses grew substantially faster than revenue, leading to widespread NOI compression. CubeSmart’s property taxes surged 17.5% year-over-year in Q4, with similar tax spikes in Indiana, Georgia, and Illinois impacting Extra Space, where same-store expenses rose by 9.5%. NSA’s expenses increased by 4.7%, driven by higher marketing, utilities, and insurance premiums. Insurance costs rose 15% to 20% across all operators, with the largest increases concentrated in Florida, Texas, and California, where climate risk re-pricing drove premiums sharply higher. Public Storage held expense growth to just 1.3%, benefiting from its AI-powered staffing model, which reduced on-site labor hours by 30%, leveraging remote management capabilities in lower-touch properties.


Self-Storage Investment & Transaction Activity
Capital deployment in 2024 was highly selective, constrained by wide bid-ask spreads and more expensive debt financing. Total self-storage transaction volume declined approximately 25% from historical averages.
Public Storage completed $221 million in acquisitions, primarily targeting infill assets in dense urban locations. Extra Space Storage invested $950 million, including $610 million in Q4 alone, with a focus on joint ventures, bridge loans, and operational partnerships. CubeSmart acquired the remaining 80% interest in a 14-property Dallas portfolio, representing a $452.8 million investment, betting on future demand recovery in this high-growth but oversupplied metro. NSA took a pruning approach, selling $270 million in non-core assets while acquiring $39 million in properties and deploying $150 million into joint ventures, targeting markets where development pipelines are tapering off.


Self-Storage Cap Rates & Bid-Ask Spread
The transaction environment remained highly selective in 2024, driven by persistent pricing gaps between buyers and sellers amid ongoing interest rate volatility. Most deal activity was concentrated in smaller, single-asset, and off-market transactions, as few large portfolio transactions materialized. Public Storage noted total industry-wide transaction volume was approximately $4 billion for the year, marking a multi-year low. Cap rates for stabilized properties generally ranged from mid-5% to low-6%.
Extra Space Storage highlighted that nearly all of its $950 million investment activity in 2024, with over $610 million occurring in the fourth quarter, was sourced off-market through existing relationships. Similarly, National Storage Affiliates saw stable deal flow primarily in smaller transactions, closing around $40 million in Q4 2024, and indicated continued market discipline as cap rates and asset prices showed little movement. Institutional investors remained cautious overall due to ongoing valuation uncertainties and the persistent pricing gap between buyers and sellers, limiting larger portfolio trades and focusing activity primarily on single-asset and relationship-driven opportunities.


Headwinds in the Self-Storage Market
The weak housing market remains the primary near-term headwind for the self-storage sector, with home sales hovering near multi-decade lows. National Storage Affiliates (NSA) specifically noted that U.S. housing turnover has fallen below Great Financial Crisis (GFC) levels, currently near its lowest point in the past 40 years. CubeSmart reinforced this, citing core inflation pressures that continue to weigh on consumer demand, leaving occupancy levels approximately 50 basis points lower year-over-year as of February 2025, despite modest recent improvements. Extra Space Storage further illustrated pricing impacts by noting that new customer rates were down 9% in Q3 2024, improved slightly to down 6% by year-end, and were approximately flat year-over-year by early 2025. Public Storage reported that although move-in volumes were up 5% year-over-year in early 2025, move-in rates remained down roughly 8%, indicating sustained pressure on rental pricing power as a result of limited housing-driven mobility. Collectively, these metrics illustrate a stabilized yet persistently challenging environment, highlighting the critical dependency of self-storage operators on improvements in housing market conditions for a meaningful recovery.
Tailwinds in the Self-Storage Market
Q4 2024 Self-Storage REIT Data by MSA
| Average Occupancy Same Store | Achieved Rate Same Store | |||||||||||
| CUBE | EXR | NSA | PSA | Average | CUBE | EXR | NSA | PSA | Average | |||
| Atlanta, GA | 88.20% | 93.80% | 81.60% | 88.40% | 88.00% | Atlanta, GA | $16.38 | $17.35 | $13.20 | $16.75 | $15.92 | |
| Austin, TX | 85.30% | 93.70% | 83.50% | - | 87.50% | Austin, TX | $18.61 | $17.87 | $17.08 | - | $17.85 | |
| Baltimore, MD | 90.90% | - | - | 91.60% | 91.25% | Baltimore, MD | $22.87 | - | - | $23.36 | $23.12 | |
| Boston, MA | 86.60% | 94.40% | - | - | 90.50% | Boston, MA | $26.92 | $28.38 | - | - | $27.65 | |
| Bridgeport, CT | 88.40% | - | - | - | 88.40% | Bridgeport, CT | $29.45 | - | - | - | $29.45 | |
| Brownsville, TX | - | - | 88.50% | - | 88.50% | Brownsville, TX | - | - | $12.93 | - | $12.93 | |
| Charleston, SC | 85.60% | 94.60% | - | - | 90.10% | Charleston, SC | $16.41 | $18.20 | - | - | $17.31 | |
| Charlotte, NC | 89.20% | - | - | 90.50% | 89.85% | Charlotte, NC | $18.57 | - | - | $15.91 | $17.24 | |
| Chicago, IL | 92.00% | 94.10% | - | 92.40% | 92.83% | Chicago, IL | $19.54 | $20.48 | - | $20.64 | $20.22 | |
| Cincinnati, OH | - | 95.00% | - | - | 95.00% | Cincinnati, OH | - | $13.41 | - | - | $13.41 | |
| Cleveland, OH | 88.30% | - | - | - | 88.30% | Cleveland, OH | $16.89 | - | - | - | $16.89 | |
| Colorado Springs, CO | - | - | 83.40% | - | 83.40% | Colorado Springs, CO | - | - | $13.74 | - | $13.74 | |
| Columbus, OH | 87.40% | 90.70% | - | - | 89.05% | Columbus, OH | $14.13 | $12.46 | - | - | $13.30 | |
| Dallas, TX | 89.00% | 94.00% | 80.70% | 87.80% | 87.88% | Dallas, TX | $18.61 | $18.09 | $14.36 | $18.22 | $17.32 | |
| DC | 89.90% | 94.60% | - | 92.00% | 92.17% | DC | $27.16 | $24.47 | - | $27.27 | $26.30 | |
| Denver, CO | 89.60% | 93.10% | - | - | 91.35% | Denver, CO | $18.93 | $19.05 | - | - | $18.99 | |
| Ft Myers, FL | 89.30% | - | - | - | 89.30% | Ft Myers, FL | $19.95 | - | - | - | $19.95 | |
| Hawaii, HI | - | 91.60% | - | - | 91.60% | Hawaii, HI | - | $46.18 | - | - | $46.18 | |
| Hartford, CT | 89.50% | - | - | - | 89.50% | Hartford, CT | $17.53 | - | - | - | $17.53 | |
| Houston, TX | 91.30% | 94.50% | 87.30% | 91.30% | 91.10% | Houston, TX | $17.83 | $17.36 | $13.16 | $17.16 | $16.38 | |
| Indianapolis. IN | - | 90.00% | - | - | 90.00% | Indianapolis. IN | - | $11.97 | - | - | $11.97 | |
| Jacksonville, FL | 90.20% | - | - | - | 90.20% | Jacksonville, FL | $20.87 | - | - | - | $20.87 | |
| Las Vegas, NV | 90.40% | 92.40% | 86.50% | - | 89.77% | Las Vegas, NV | $19.02 | $17.38 | $14.21 | - | $16.87 | |
| Los Angeles, CA | 90.70% | 94.50% | 86.20% | 94.10% | 91.38% | Los Angeles, CA | $28.43 | $30.08 | $24.48 | $36.23 | $29.81 | |
| Louisville, KY | - | 90.70% | - | - | 90.70% | Louisville, KY | - | $11.64 | - | - | $11.64 | |
| Memphis, TN | - | 92.70% | - | - | 92.70% | Memphis, TN | - | $11.74 | - | - | $11.74 | |
| McAllen, TX | - | - | 89.10% | - | 89.10% | McAllen, TX | - | - | $13.24 | - | $13.24 | |
| Miami, FL | 92.00% | 94.30% | - | 92.60% | 92.97% | Miami, FL | $25.48 | $27.64 | - | $29.95 | $27.69 | |
| Nashville, TN | 88.00% | - | - | - | 88.00% | Nashville, TN | $16.75 | - | - | - | $16.75 | |
| New Orleans, LA | - | - | 79.40% | - | 79.40% | New Orleans, LA | - | - | $15.18 | - | $15.18 | |
| New York | 90.40% | 94.70% | - | 93.00% | 92.70% | New York | $37.46 | $29.60 | - | $32.48 | $33.18 | |
| Norfolk, VA | - | 94.20% | - | - | 94.20% | Norfolk, VA | - | $18.13 | - | - | $18.13 | |
| OKC, OK | - | - | 84.40% | - | 84.40% | OKC, OK | - | - | $11.12 | - | $11.12 | |
| Orlando, FL | 91.90% | 93.60% | - | 91.30% | 92.27% | Orlando, FL | $16.87 | $17.28 | - | $18.78 | $17.64 | |
| Philadelphia, PA | 89.70% | 93.70% | - | 92.60% | 92.00% | Philadelphia, PA | $21.20 | $20.16 | - | $20.65 | $20.67 | |
| Phoenix, AZ | 89.20% | 93.80% | 82.60% | - | 88.53% | Phoenix, AZ | $17.17 | $17.29 | $15.57 | - | $16.68 | |
| Portland. OR | - | 95.90% | 88.40% | - | 92.15% | Portland. OR | - | $19.81 | $18.81 | - | $19.31 | |
| Providence, RI | 90.20% | - | - | - | 90.20% | Providence, RI | $19.73 | - | - | - | $19.73 | |
| Richmond, VA | - | 95.60% | - | - | 95.60% | Richmond, VA | - | $18.39 | - | - | $18.39 | |
| Riverside, CA | 86.90% | - | 86.90% | - | 86.90% | Riverside, CA | $19.76 | - | $15.90 | - | $17.83 | |
| Sacramento, CA | 88.60% | 95.10% | - | - | 91.85% | Sacramento, CA | $17.87 | $20.54 | - | - | $19.21 | |
| San Antonio, TX | 88.60% | - | 82.90% | - | 85.75% | San Antonio, TX | $16.67 | - | $15.22 | - | $15.95 | |
| San Diego, CA | 89.00% | - | - | - | 89.00% | San Diego, CA | $27.08 | - | - | - | $27.08 | |
| San Fransisco, CA | - | 95.00% | - | 93.30% | 94.15% | San Fransisco, CA | - | $35.35 | - | $33.12 | $34.24 | |
| Sarasota, FL | - | - | 89.50% | - | 89.50% | Sarasota, FL | - | - | $19.56 | - | $19.56 | |
| Seattle, WA | - | - | - | 92.00% | 92.00% | Seattle, WA | - | - | - | $25.96 | $25.96 | |
| Tampa, FL | 93.60% | 96.30% | - | - | 94.95% | Tampa, FL | $20.92 | $19.75 | - | - | $20.34 | |
| Toucson, AZ | 83.90% | - | - | - | 83.90% | Toucson, AZ | $17.08 | - | - | - | $17.08 | |
| Tulsa, OK | - | - | 84.90% | - | 84.90% | Tulsa, OK | - | - | $11.01 | - | $11.01 | |
| West Palm Beach, FL | - | - | - | 91.60% | 91.60% | West Palm Beach, FL | - | - | - | $26.09 | $26.09 | |
| Wichita, KS | - | - | 85.80% | - | 85.80% | Wichita, KS | - | - | $13.10 | - | $13.10 | |
| Other | 89.10% | 94.50% | 84.70% | 91.80% | 90.03% | Other | $19.02 | $17.65 | $15.17 | $18.40 | $17.56 | |
| Total | 89.60% | 94.10% | 85.20% | 91.80% | 90.18% | Total | $22.89 | $21.63 | $15.56 | $22.66 | $20.69 | |